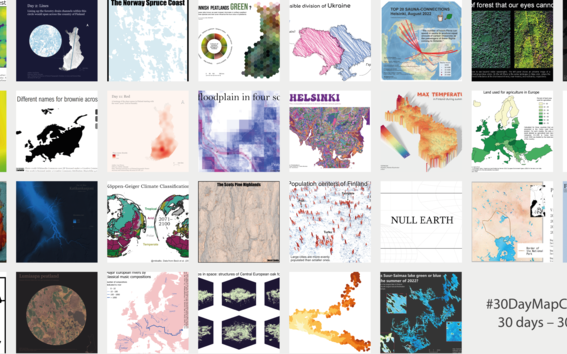
#30DayMapChallenge: 30 days – 30 maps
#30DayMap Challenge is a widespread Twitter challenge initiated by Topi Tjukanov, a geographer from Helsinki, in 2019. Since then, every year in November, participants all over the globe post their maps: one map per one-day topic. Overall, 30 maps per 30 days in November. This year the group of Geoinformatics in Aalto University joined the 30DayMapChallange, connecting our research work with topics of the day.

Day 1: Airborne LiDAR (light detection and ranging) points indicate the trees' height in the Finnish forest.
Map by Aarne Hovi (@AarneHovi).
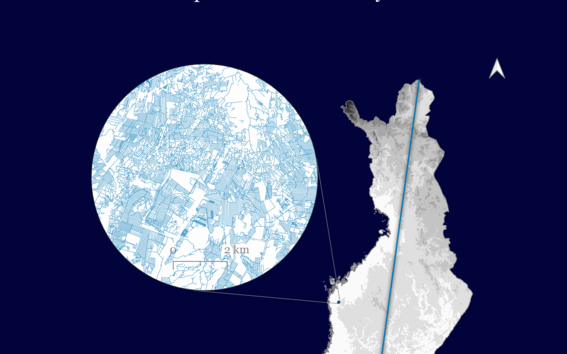
Day 2: Lining up the forestry drain channels within this circle would span across the country of Finland.
Map by Lari Pernu (@laripernu).

Day 3: The photo of the spruce bark can look like a coastal area. This map helps you to see the Norway Spruce Coast in a hyperspectral image of Norway spruce stem bark.
Map by Jussi Juola.
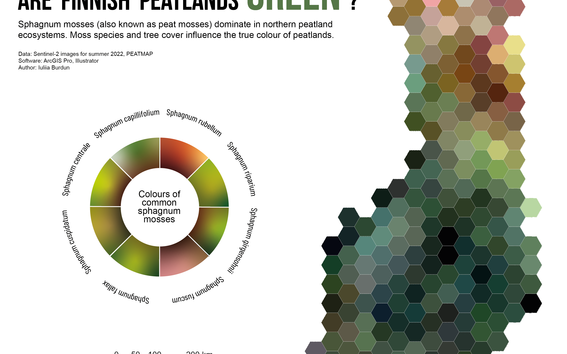
Day 4: The median colour of Finnish peatlands estimated from satellite images Sentinel-2 for summer 2022.
Map by Iuliia Burdun (@BurdunIuliia).

Day 5: The only possible division of Ukraine is when one half says: "Slava Ukraini!", and another one replies: "Heroyam slava!".
Map by Iuliia Burdun (@BurdunIuliia).
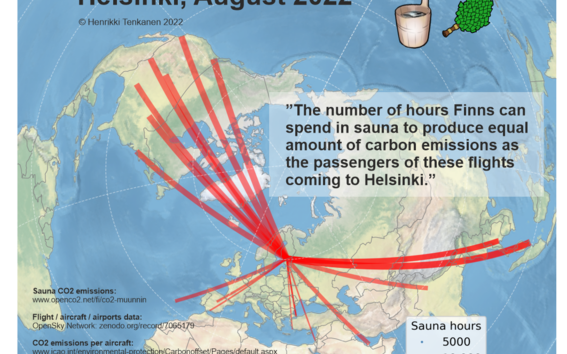
Day 6: Have you ever visited a Finnish sauna? We love it too! Our sauna-aviation index shows how many hours Finns can sweat in a sauna with the same carbon footprint as the people on these flights.
Map by Henrikki Tenkanen (@tenkahen).

Day 7: It's hard to overestimate the informativeness of hyperspectral airborne images for forestry.
Map by Aarne Hovi (@AarneHovi).
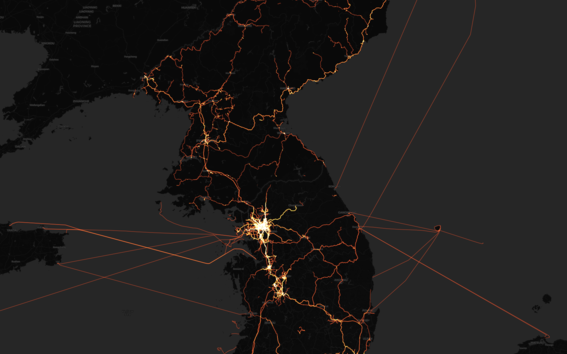
Day 8: Transport lines of OSM in South and North Korea.
Map by Henrikki Tenkanen (@tenkahen).
Day 9: LiDAR points fill the space! Demonstrating DEM generation through TIN densification somewhere in Finland. See it here: https://twitter.com/AaltoGeoinfo/status/1590278333652037632
Map by Aarne Hovi (@AarneHovi).
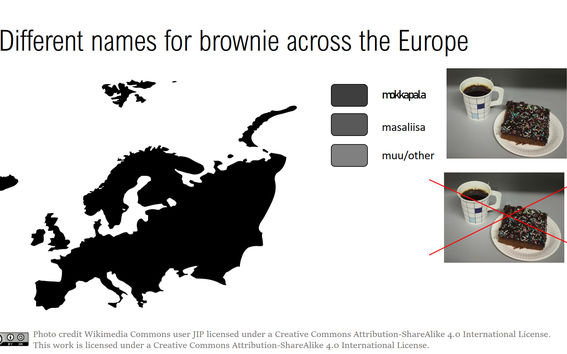
Day 10: What should or should not have a bad map?
Map by Sini-Selina Salko (@SalkoSini).
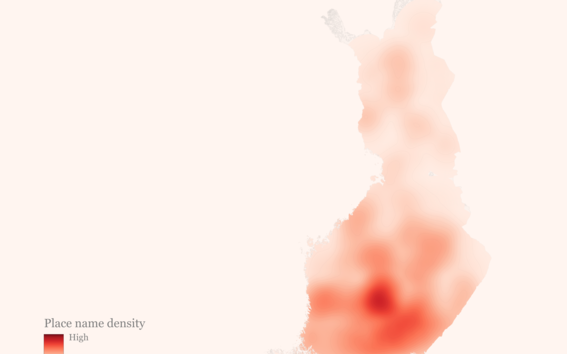
Day 11: A heatmap of the Finnish place names starting with the Finnish word for red.
Map by Lari Pernu (@laripernu).

Day 12: The inundation probability of the Tonle Sap River's floodplain in Cambodia is shown in four scales.
Map by Marko Kallio (@mkkallio).
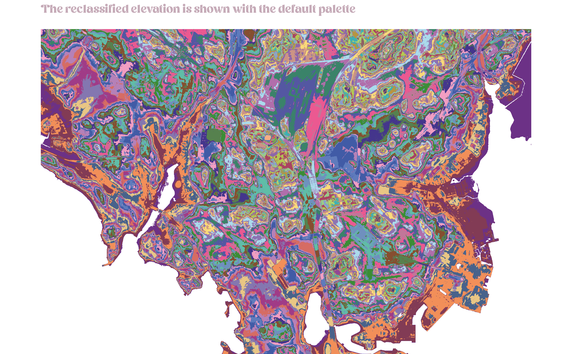
Day 13: "Disco" Helsinki.
Map by Iuliia Burdun (@BurdunIuliia).
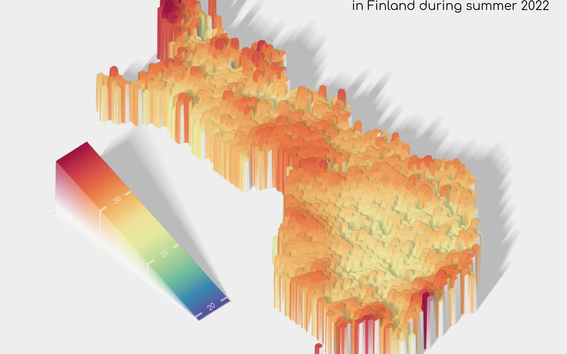
Day 14: The maximum land surface temperature was obtained with the MODIS Terra satellite over Finland in the summer of 2022.
Map by Iuliia Burdun (@BurdunIuliia).
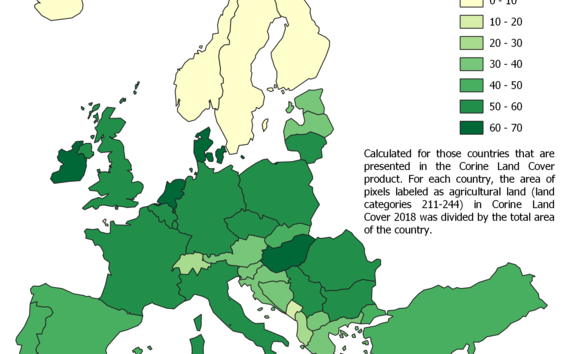
Day 15: Percent of land area used for agriculture in Europe.
Map by Aarne Hovi (@AarneHovi).
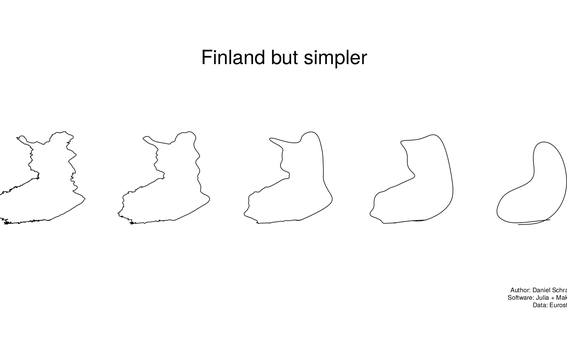
Day 16: Finland, but simpler.
Map by Daniel Schraik (@daniel_schraik).
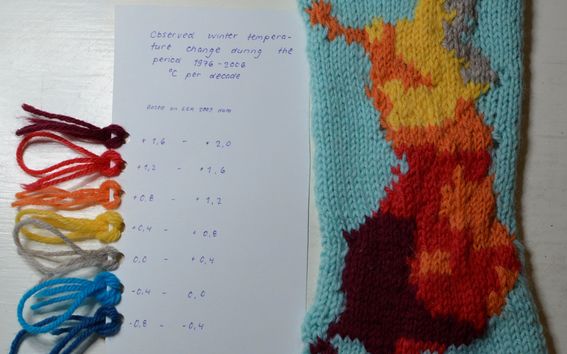
Day 17: If the winter temperatures keep rising at the same rate, maybe soon we won't need any woollen socks, and everybody will take up knitting maps instead.
Map by Sini-Selina Salko (@SalkoSini).

Day 18: Katikankanjoni is a 20-meter-deep river canyon in Finland.
Map by Lari Pernu (@laripernu).

Day 19: Global present and future Köppen-Geiger climate classification maps.
Map by Marko Kallio (@mkkallio).

Day 20: My favourite Scots pine stem bark. Pine's bark looks like highlands with canyons.
Map by Jussi Juola.

Day 21: Population centres of Finland are shown with Kontur population data.
Map by Marko Kallio (@mkkallio).

Day 22: There's nothing on Null Earth, no matter how you project it.
Map by Marko Kallio (@mkkallio).
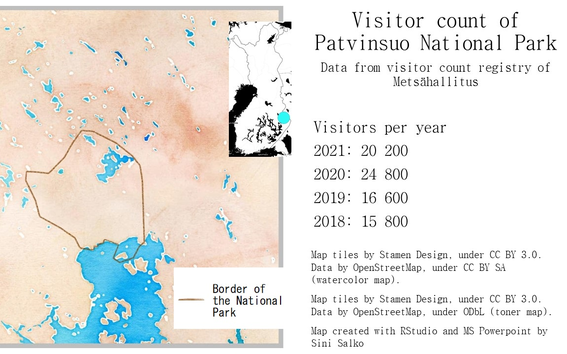
Day 24: Do people use peatlands for recreation? More than before, at least in the National Park of Patvinsuo peatland in Eastern Finland.
Map by Sini-Selina Salko (@SalkoSini).
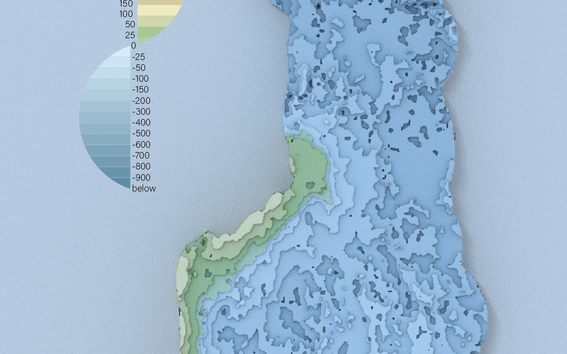
Day 24: What if Atlantis was located a bit to the north? Then it would be Finlantis!
Map by Iuliia Burdun (@BurdunIuliia).
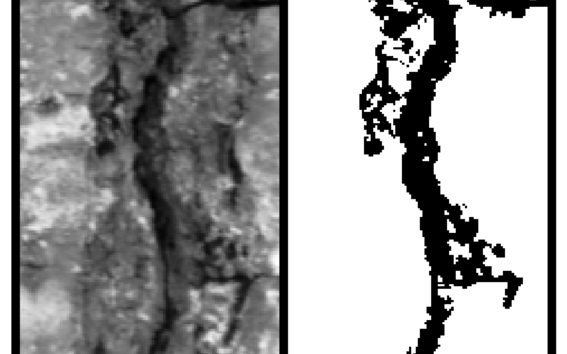
Day 25: Two colours show the topography of the English Oak Floodplain, originally derived from the photo of the English oak tree.
Map by Jussi Juola.
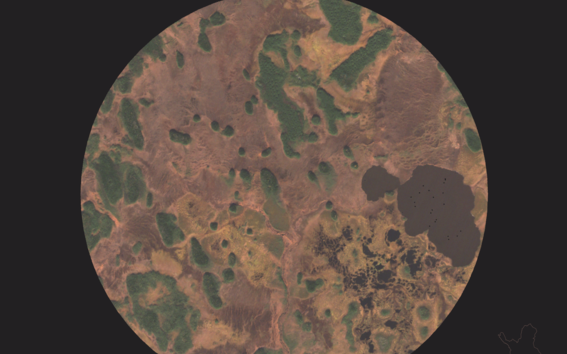
Day 26: "Islands" of forest in Lumiaapa peatland in Finland.
Map by Lari Pernu (@laripernu).
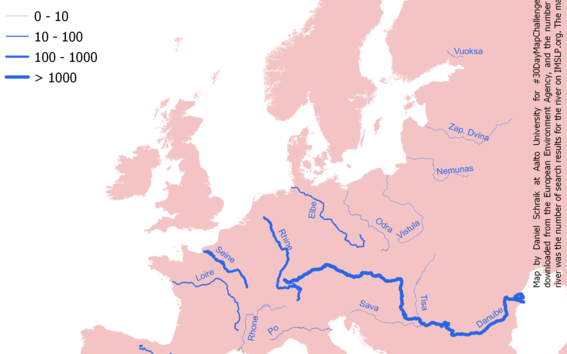
Day 27: Major European rivers by classical music compositions.
Map by Daniel Schraik (@daniel_schraik).

Day 28: Forest canopy structure in different oak stands of a Central European floodplain forest, quantified by terrestrial lidar.
Map by Daniel Schraik (@daniel_schraik)
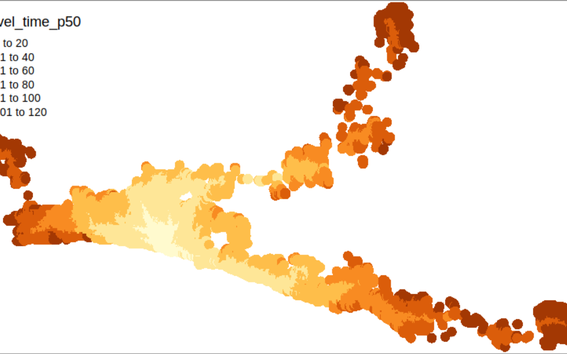
Day 29: Travel times to Brighton railway station by bus after ten years of pause from using R.
Map by Henrikki Tenkanen (@tenkahen).
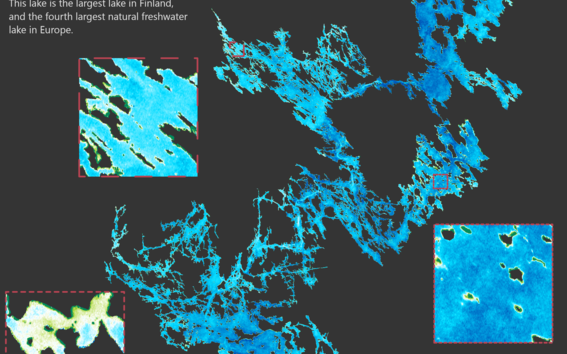
Day 30: The dominance of blue or green colours in the biggest Finnish lake over the summer of 2022.
Map by Iuliia Burdun (@BurdunIuliia).
About the authors: The authors are doctoral researchers, postdocs, a master's student and an assistant professor in the Department of Built Environment (Aalto University).
Show other posts from this blog

Länsi-Antarktis on mannerjäätiköiden heikko kohta
Läntisen Etelämantereen jäätiköt ovat avainasemassa siinä, kuinka nopeasti merenpinta alkaa nousta ilmaston lämmetessä.
Development of Finnish agricultural parcel structure 2010-2020: a spatial analysis
Hermanni Hentunen analyzes the temporal development of parcel structure in Finland between the years 2010 and 2020.
What is the value of earth observation data?
With socioeconomic impact assessment it is possible to specify and quantify the impact that earth observation data has on our society.